Solar Energy Information
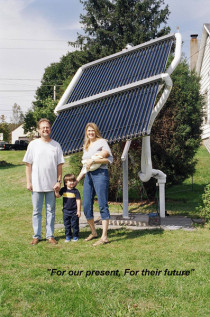
"The energy revolution is upon us. You can embrace it, be skeptical of it, or ignore it but it will not go away. The revolution
will succeed because our very survival depends on it." WHFIII
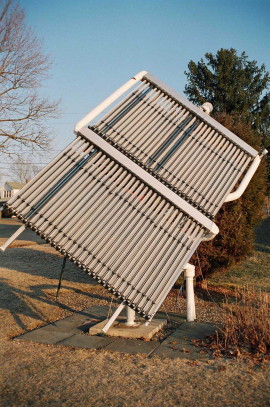
The above SFB-30's were setup to track the sun. This is not the normal way the collectors are mounted. The majority of the time the units are mounted to the roof of the structure, or as a free standing fixed array. Care must be taken with free standing arrays to make sure they are not subject to the structure's shadow's over the course of the day, and designed strong enough to handle the weight and wind loadings of the collectors. Ground supports should go down below the frost line, usually four to five feet depending on the climate. When a thermal solar array (Not PV) is more than about fifty feet from the storage tank or delivery point, piping losses can become significant. Great attention should be paid to the total heat loss per foot of the piping run, not just the R-value of the pipe insulation, which by itself, does NOT represent the total heat lost!!
General System Sizing guidelines.
For DHW, (Domestic Hot Water) :
One SFB-30 for one to three people, 50 to 80 gallons of storage. Two SFB-30's four to six people, 80 to 160 gallons of storage.
For single tank DHW "boost" system: (Backup tank is also solar tank)
One SFB-20 or one SFB-30, existing single tank 40 to 80 gallons of storage.
Space heating arrays in the Northeast:
Usually, 6 or more SFB-30's are required to make any kind of "real" dent in space heating loads for a typical square footage house (2000-3000 sqft). Many factors go into planning the "right" total system for any given house because there is so much variability in home construction.
Ten "Key" points in designing any solar thermal (Heat) system.
Mounting angle should be determined by the latitude and solar application. For DHW (Domestic Hot Water) only, the angle the back edge of the collector is raised up from the horizontal, should equal the latitude. For space heating, 20 Degs minimum more than latitude, all the way to vertical (Snow regions) works well. For Summer pool heating, 20 Degs minimum under latitude works fine.
Units should face true south if possible. Up to 20 Degs East or West of South will not have a significant impact.
Care should be taken in choosing the collector location. The location should receive as much sun as possible and be free from shadowing from All sources. They should be as close as possible to the thermal storage tank(s) if used, to keep the piping runs to and from as short as possible. This is very important especially if a non drain-back system is employed. If the system is to be expanded later, make sure you allow room for the additional collectors.
Drain back "styles" of systems should be used whenever possible. Allot of heat is used, heating up the anti-freeze in a closed loop system at the start of each day. Additionally, that heat is "left behind" at the end of the day unable to be utilized. It does add up to significant amounts. The longer the run the greater the accumulated losses.
Insulation values of R20 or greater should be used on piping runs. Solar energy is a low temperature large area heat source which is not on demand. This makes solar thermal installations very sensitive to piping run losses. The longer the run the greater the loss. R value by itself does not represent the total heat loss for the piping run, but is offered as a very general guide point. Care should be taken to reduce run losses to an absolute minimum, so the solar investment is not wasted. The importance of High R-value per inch insulation can not be over stated.
The system should be designed "in balance" with itself along with the application and "life style" of the user. What this refers to is the main parts of the system, collectors, infrastructure and storage, should be sized for each other, and then as a whole, sized for the application. The users "life style" can effect over all design aspects as well, from sizing to control specifics.
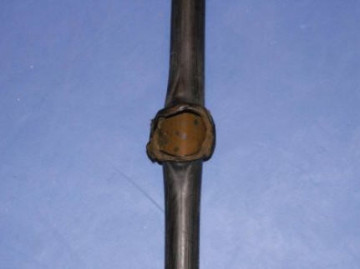
For all but low temperature applications, copper pipe should be used throughout the entire infrastructure. This is particularly important with evacuated tube collectors due to their higher temperature capability. There are few exceptions to this. Plastic pipe can maintain integrity under normal system circumstances, but under stagnation conditions, excessive temperatures can cause the plastic to soften and blow out even under closed loop low system pressures as shown below.
Care should be taken on choosing insulation that will handle the maximum temperatures at various places in the system. Again, insulation on or near evacuated tube collectors should handle stagnation temperatures, often greater than 300 DegF.
A backup power scheme should be included with the system. There is no reason to allow the system to be subjected to freezing temperatures if potentially harmful, or stagnation temperatures either, in sunny power fail situations.
If saving re-occurring energy expenses is the reason you are doing solar, then keep in mind the more you spend up front for your products, the longer the
return on the investment. Good products are available for very reasonable prices, without spending thousands of dollars extra for a couple of percent more in extra efficiency, of which
the investment return you will never see over the life of the system.
You can do "Green" without putting yourself in the "Red".
Carbon VS Alkaline??? An Analogy....
Just like the old battery commercials comparing Carbon to Alkaline, the comparisons between flat plates and evacuated tube collectors are much the same. In reality though, Alkaline's are a far superior technology, so comparing them to Carbon was sort of like comparing a 1930's Indy car to a 2000 Indy car. There just isn't a comparison. The photo below was taken on March 23, 2005, at 7:15AM in the morning, after a fairly heavy frost. Four of the sixty evacuated tubes had their vacuum's deliberately compromised. Anotherwards, they have air, just like a flat plate collector between the absorber and the outer glass glazing, no vacuum! Can you spot the four tubes that have had the ice melted off by the escaping collected solar heat? .....Comparison ended......
Real data for above array!!!!!
01/18/2005 Overnight low 7 DegF
Average outside daytime temperature 10 DegF
Available direct solar radiation 40 Deg Latitude, per square foot all day total 2182 BTU's * 60 sqft = 130,920 BTU's gross energy
Storage starting temperature 68 DegF
Storage ending temperature 94 DegF
Storage temperature gain 26 DegF = 78,000 BTU's (3000 pound water storage unit)
BTU usage during solar gain period 4,000 BTU's
Total net solar gain 82,000 BTU's (78,000 + 4,000)
efficiency = 63 % ( 82,000 /130,920)
01/21/2005 Overnight low 2 DegF
Average outside daytime temperature 8 DegF
Available direct solar radiation 40 Deg Latitude, per square foot all day total 2182 BTU's * 60 sqft = 130,920 BTU's gross energy
Storage starting temperature 68 DegF
Storage ending temperature 97 DegF
Storage temperature gain 29 DegF = 87,000 BTU's (3000 pound water storage unit)
BTU usage during solar gain period 3,000 BTU's
Total net solar gain 90,000 BTU's (87,000 + 3,000)
efficiency = 69 % ( 90,000 /130,920)
01/27/2005 Overnight low -2 DegF
Average outside daytime temperature 13 DegF
Available direct solar radiation 40 Deg Latitude, per square foot all day total 2282 BTU's * 60 sqft = 136,920 BTU's gross energy
Storage starting temperature 65 DegF
Storage ending temperature 95 DegF
Storage temperature gain 30 DegF = 90,000 BTU's (3000 pound water storage unit)
BTU usage during solar gain period 3,000 BTU's
Total net solar gain 93,000 BTU's (90,000 + 3,000)
efficiency = 68 % ( 93,000 /136,920)
01/28/2005 Overnight low -12 DegF
Average outside daytime temperature 14 DegF
Available direct solar radiation 40 Deg Latitude, per square foot all day total 2282 BTU's * 60 sqft = 136,920 BTU's gross energy
Storage starting temperature 82 DegF
Storage ending temperature 105 DegF
Storage temperature gain 23 DegF = 69,000 BTU's (3000 pound water storage unit)
BTU usage during solar gain period 6,000 BTU's
Total net solar gain 75,000 BTU's (69,000 + 6,000)
efficiency = 55 % ( 75,000 /136,920)
01/31/2005 Overnight low 12 DegF
Average outside daytime temperature 32 DegF
Available direct solar radiation 40 Deg Latitude, per square foot all day total 2332 BTU's * 60 sqft = 139,920 BTU's gross energy
Storage starting temperature 81 DegF
Storage ending temperature 104 DegF
Storage temperature gain 23 DegF = 69,000 BTU's (3000 pound water storage unit)
BTU usage during solar gain period 6,000 BTU's
Total net solar gain 75,000 BTU's (69,000 + 6,000)
efficiency = 54 % ( 75,000 /139,920)
02/01/2005 Overnight low 0 DegF
Average outside daytime temperature 32 DegF
Available direct solar radiation 40 Deg Latitude, per square foot all day total 2332 BTU's * 60 sqft = 139,920 BTU's gross energy
Storage starting temperature 94 DegF
Storage ending temperature 114 DegF
Storage temperature gain 20 DegF = 60,000 BTU's (3000 pound water storage unit)
BTU usage during solar gain period 9,000 BTU's
Total net solar gain 69,000 BTU's (60,000 + 9,000)
efficiency = 49 % ( 69,000 /139,920)
02/02/2005 Overnight low 0 DegF
Average outside daytime temperature 35 DegF
Available direct solar radiation 40 Deg Latitude, per square foot all day total 2332 BTU's * 60 sqft = 139,920 BTU's gross energy
Storage starting temperature 102 DegF
Storage ending temperature 120 DegF
Storage temperature gain 18 DegF = 54,000 BTU's (3000 pound water storage unit)
BTU usage during solar gain period 10,000 BTU's
Total net solar gain 64,000 BTU's (54,000 + 10,000)
efficiency = 48 % ( 64,000 /139,920)
03/15/2005 Overnight low 17 DegF
Average outside daytime temperature 35 DegF
Available direct solar radiation 40 Deg Latitude, per square foot all day total 2916 BTU's * 60 sqft = 174,960 BTU's gross energy
Storage starting temperature 102 DegF
Storage ending temperature 122 DegF
Storage temperature gain 20 DegF = 60,000 BTU's (3000 pound water storage unit)
BTU usage during solar gain period 4,000 BTU's
Total net solar gain 64,000 BTU's (60,000 + 4,000)
efficiency = 37 % ( 64,000 /174,960)
System detail of 03/15/2005:
The following chart shows collector, storage and return temps hourly throughout the day: Lessons to be learned, you cannot over insulate piping runs!! All temps DegF.
Note also the difference in storage gain between sunrise and 9:00am VS 3:00pm and sunset. System is anti-freeze closed loop.
Time of Day Return Collector Storage
Outside
Sunrise n/a
20 102 16
8:00am 108
112 103 20
9:00am 113
118 104 23
10:00am 117
122 107 26
11:00am 119
124 109 30
12noon 122
126 111 34
1:00pm 124
129 114 35
2:00pm 126
131 116 37
3:00pm 127
132 118 40
4:00pm 127
132 120 42
5:00pm 123
127 122 40
EOD cycling at 5:15pm
At these temperatures, 1/3 or more of the energy is lost in the piping run of this system!! Total run ~140'.
03/27/2006 Overnight low 32 DegF
Average outside daytime temperature 48 DegF
Available direct solar radiation 40 Deg Latitude, per square foot all day total 2916 BTU's * 60 sqft = 174,960 BTU's gross energy
Storage starting temperature 72 DegF
Storage ending temperature 106 DegF
Storage temperature gain 34 DegF = 102,000 BTU's (3000 pound water storage unit)
BTU usage during solar gain period 3,000 BTU's
Total net solar gain 105,000 BTU's (102,000 + 3,000)
efficiency = 60 % ( 105,000 /174,960)
Analysis of 01/21 & 01/27: They were absolutely perfectly cloudless days, very, very clear, low water vapor, plus we had some more snow on the ground adding solar
ground reflection gain. Big factor, a cool storage reducing piping run loss.
Note: All PSD's are not created equal.
Rule Of Thumb: AS a general "feel" for the collectors on a full overcast day, it goes about like this: On a very dark overcast day, the collectors will reach under a no flow condition about 30 DegF above ambient. On a average brightness fully overcast day, they will reach under a no flow condition about 50 to 60 DegF above ambient, and on a bright fully overcast day (Still not able to see ring of sun) they will reach under a no flow condition about 80 to 100 DegF above ambient.
Last Updated 4/11/2024
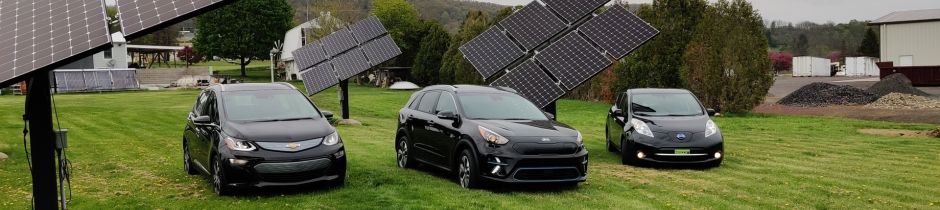
2023 is another PV Record Buster !!
Its official! 2023 is also a PV production record buster. The main tracking array produced 18.887 MWH's which is about 1.1 MWH's less than last year. However, the gorund test array added another 3960 KWH's to that, totaling 22.847MWH's, an increase over last year of 2.249 MWH's total.
UPDATE 6/23: Kia Nero traded in for Kia EV6.
UPDATE 9/22: New 40+ KWH battery backup installed with coming 4.6KW direct feed array. See details under 'My Solar Home', Solar PV.
********************************************
********************************************
Where to Find Us:
www.WeAreSolar.com (Fitch Consulting)
1072 Fowlersville Rd
Berwick, PA 18603
Phone: 570-752-4827
Email: fcfcfc@pa.metrocast.net
Peak solar production for my house in one day is about 130KWH.
What's New
01/12/2021 My new GEO heat pump is finally installed. I have been "tweeking" it until today, 01/16/2021. It works GREAT!! Unlike it predecessor's, it actually performs up to its submittal sheet. LOVE IT!!

I finally finished my electric overhead to underground conversion along with the transformer upgrade (15KW to 50KW).
May Monthly Production Record Gets blown away in June at 2517KWH !!
Made changes to my PV tracking system. The main PV inverter was upgraded from an SMA SB-US-8000 to a Fronius Primo 11.4 (11,400 watts). Additionally, the PV arrays were upgraded with 20 SunPower 327 watt modules leaving 16 of the original Canadian Solar 255 watt modules, bringing the total output of the array from 9.18KW to 10.620KW. The combination of the inverter upgrade coupled with the array KW upgrade, should generate an additional 2 to 3 MWH a year. I hope this will compensate for the increased cloudiness being produced by Green House Gas Heating Climate change. It took a fair amount of work to do all this....
UPDATE: All 36 modules are being changed out which will result in an array output of 11,772 KW. On a very sunny year, 20 MWH should be within reach.
PV Yearly Production Numbers
2021 PV Production is 19.325 MWH which just misses the record breaker last year. Across the year, 2021 was much cloudier but crazy super sunny March made it almost even. Since the system has been running, we have produced over 129 MWH's total.
2020 PV Production is 19.375 MWH which is a new record buster.!! The only month that did not gen more than last year was October. Our usage was up due to more driving and general increases, which the increase in production was able to satisfy. That production defers about $2000.00 worth of power from the grid.
2019 PV Production is 16.787 MWH.
2018 PV Production is 12.463 MWH.
2017 PV production is 14.293 MWH.
2016 PV production is 15.629 MWH.
2015 PV production is 14.543 MWH.
2014 PV production is 7.711 MWH, first year partial production. 9.374 MWH were produced through the entire startup test phase of the system before certification.
2019 production was a record breaker, do to the upgrade being active for 1/2 the year along with being decently sunny. Most likely, if the array upgrade had been active for the whole year, 17 or 18 MWH's would have easily been had.
2018 production was the worst production ever, not only for PV but for all solar. The rain and cloud cover was unpresidented! WE blew right through the 13 Megawatt range and landed in the low 12's. An increase in array capacity might be necessary to adapt to the GH GH'ing realities causing climate change, to resore a slight electrical surplus.
2017 production down 1.34 MWH from last year. All months produced less except for December which is the cloudiest month of the year.... Ironic...
Electric car miles for the fifth year are 15863 saving 690 gallons of gas at an avoided cost of $1932, bringing the five year total to $9172.00. Covid-19 reduced mileage, but a third car (Bolt) and a third driver beginning in August, over turned the shortfall.
Electric car miles for the forth year are 14037 saving 610 gallons of gas at an avoided cost of $2014.00 bringing the four year total to $7239.00. Gas went up and down over the period.
Electric car miles for the third year are 13,220 saving 575 gallons of gas at an avoided cost of $1955.00 bringing the three year total to $5225.00. Gas prices steadily climbed throughout the year. Total number of gallons not used stands at 1790.
Electric car miles for the second year are 14,830 saving 645 gallons of gas at an avoided cost of $1870.00 bringing the two year total to $3270.00. Not bad for only 2 years at fairly low gas prices...
Electric car miles for the first year ran about 13,000 miles of energy free driving. The gas saved which would have been burned by the car that the Leaf replaced equals about 570 gallons at an avoided gas cost of $1400.00.
Total mileage across the three years equals 41,050 miles. At a gross electric usage of 3 miles per KWH year round, this translates to 13.68 Megawatt hours of electricity, or 4.56 Megawatt hours per year. With the addition of the Ford C-Max plug-in Hybrid over the last year, the total transportation electric load is increased by about 2 megawatt hours more, bringing the household trans electric yearly load to about 6.6 megawatt hours.