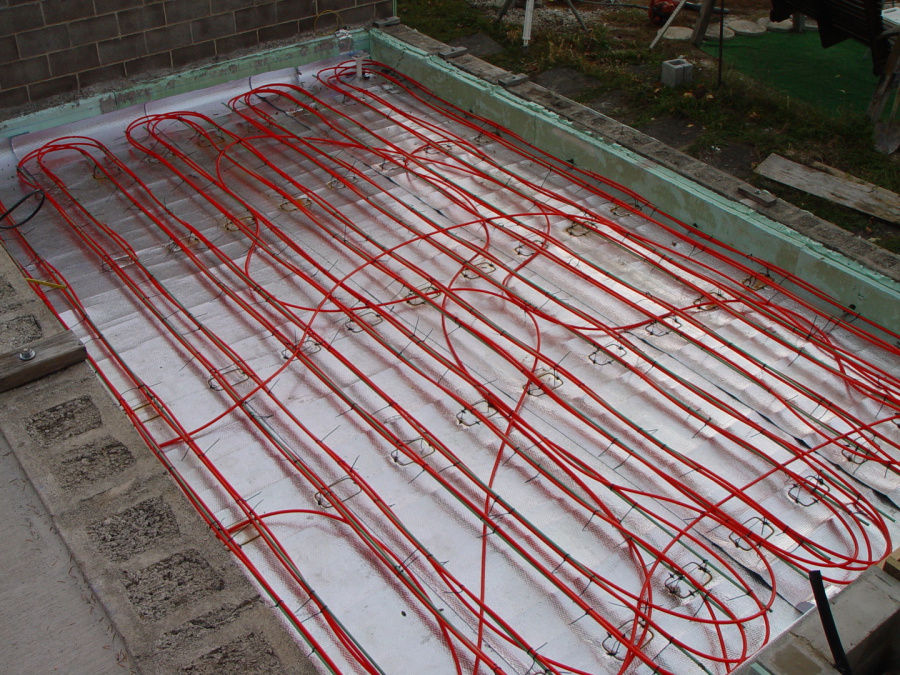
PEX fill !
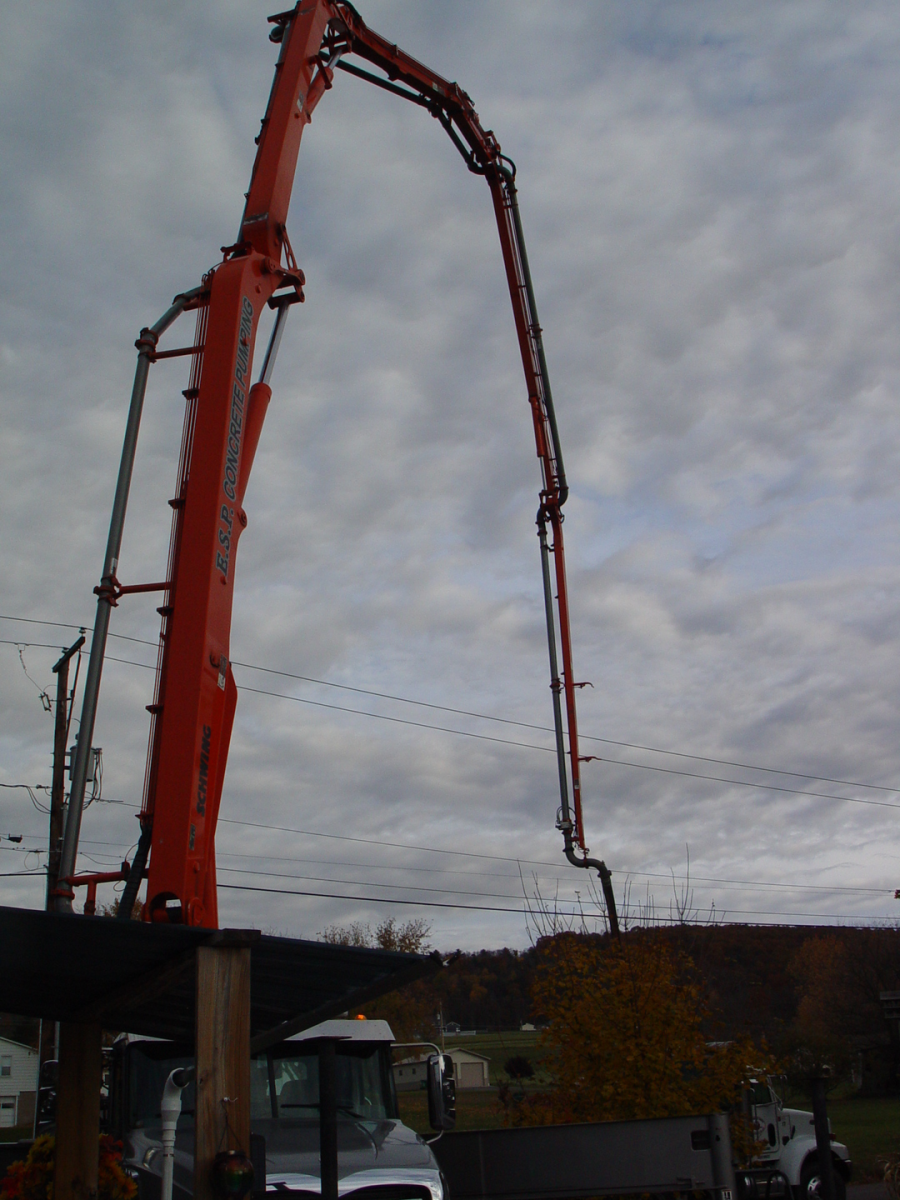
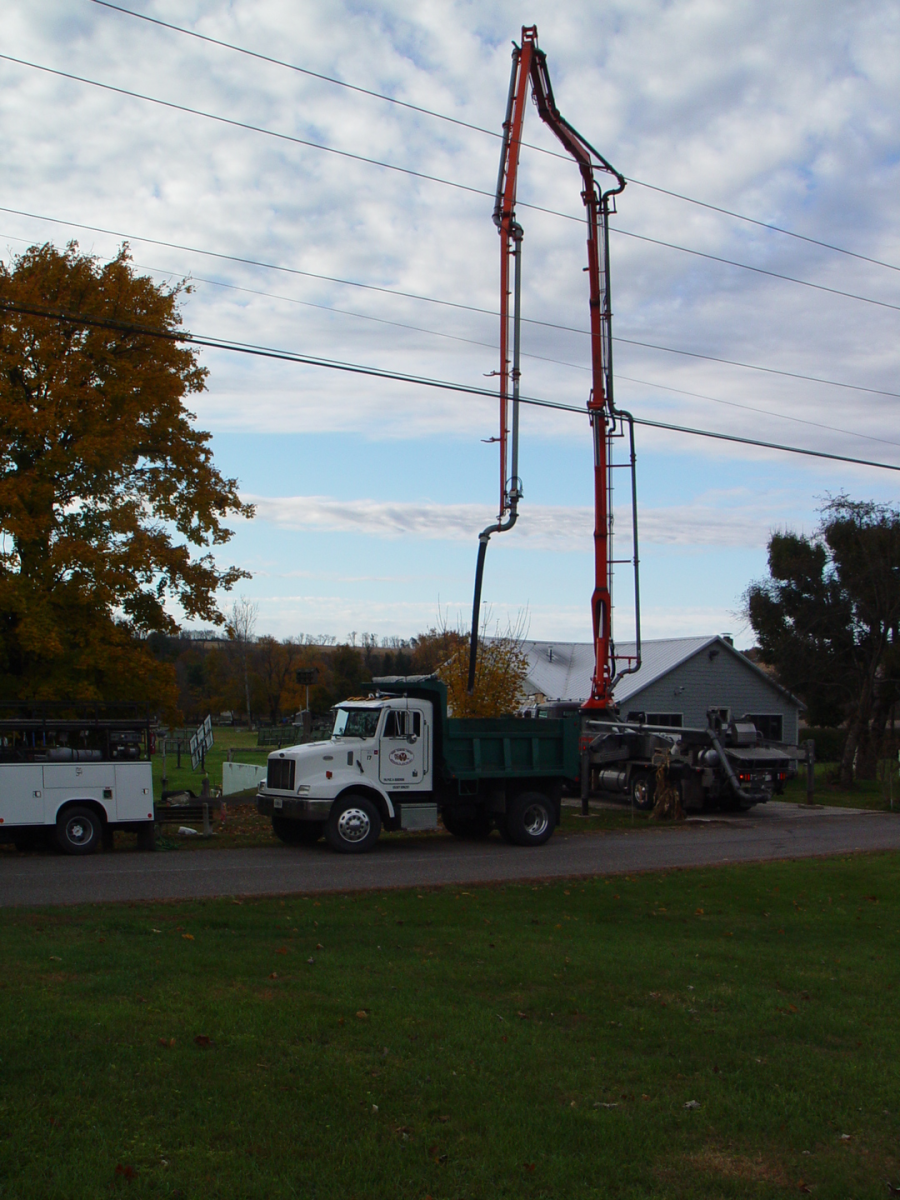
Here are pictures of my concrete floor fill with the PEX floors for passive solar and active boost (If desired) for my new expansion. I was expecting the pump rig to be a "hand unit" with a hose over the wall with 2 guys on it, type of thing, etc.. When I came out the side door and looked up, I just about $hit! The instantanous creative impulse and accomping picture (Later) I called the "steel rainbow". ~50' up!
Breaking news!!
Diesel truck catches fire (9/29/2025) video MP4 clip!! Use software that has Zoom capability to view! It is amazing how fast it goes from just some smoke to an engulfing fire. Two explosions happen while burning, the two bright flashes.
Remember for every 1 EV fire per 100,000 cars, there are 61 ICE fires per 100,000. Who's dangerous?!
This truck caught fire on September 30 early evening. Driver got out.
Truck fire.mp4
MP4 video/audio file [74.6 MB]

MEGA Hats!!
Make EARTH Green Again!!
Show your support.
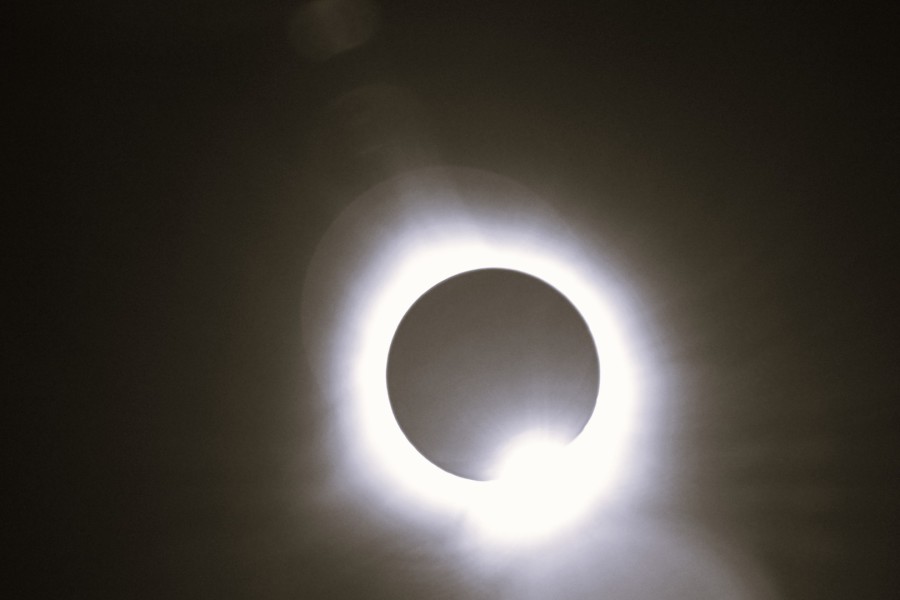
Solar Eclipse 2024 Fairfield Bay, AR


----------------------------------------------------------------
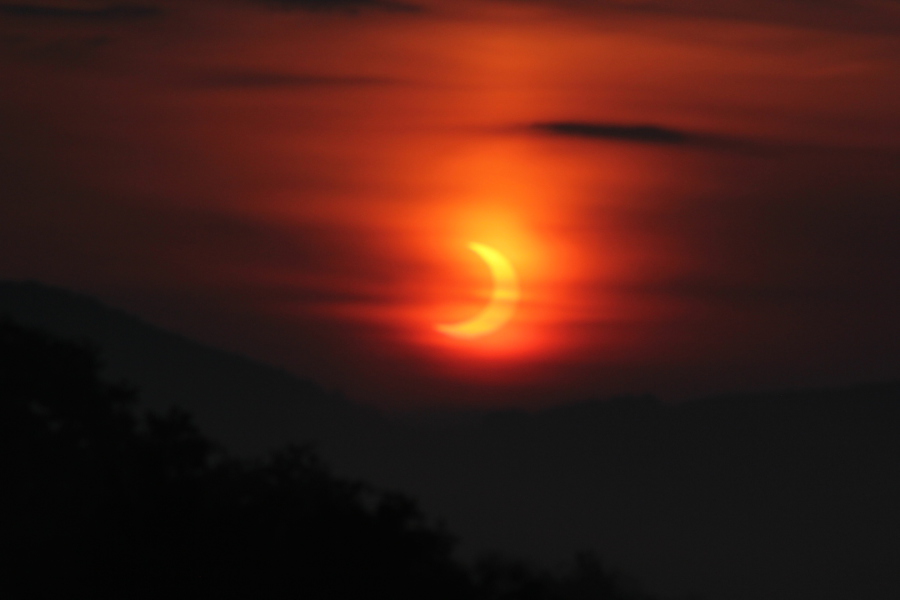
Annular Solar Eclipse from here at 5:40AM 6/10
3" x 10" Sticky Decal. It is available for $5.95 plus $1.50 S&H.

Sticky bumper stickers are available in the TOP contemporary expanding images "Art Look".

Additionally there are BookMarkers 2" x 6" (5pk) for $5.95 for your next reading pleasure.....
Bumper Sticker <Click> OR Book Markers <Click>
-------------------------------------------------------------------------------------------------

This is my main solar PV array with its extreme makeover. Black is the new green and 3KW more power. I also hit a new single day power production level of 107.5 KWH. No surprise really with the upgrade in panels and inverter.
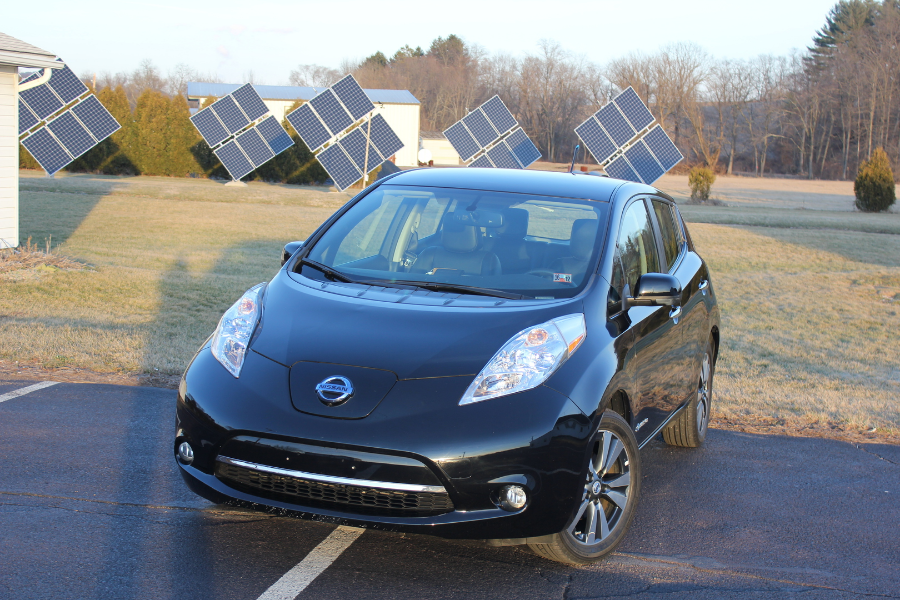
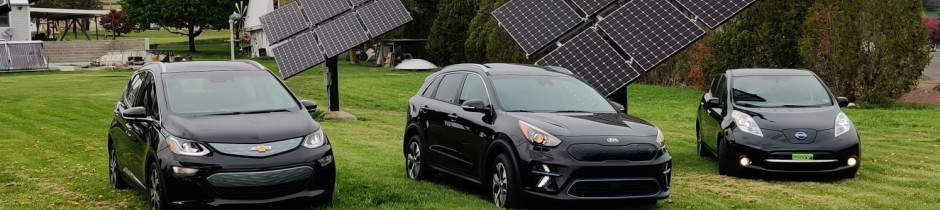
This is my new 2013 Nissan Leaf, 8700 miles when acquired, AND I LOVE IT!!!!
I got it on 11/13/2015. Winter driving is running about 2.1 to 2.2 miles per gross KWH.
UPDATE: Summer is running around 3.5 miles per Gross KWH, 4.2 to 4.5 on board miles per KWH.
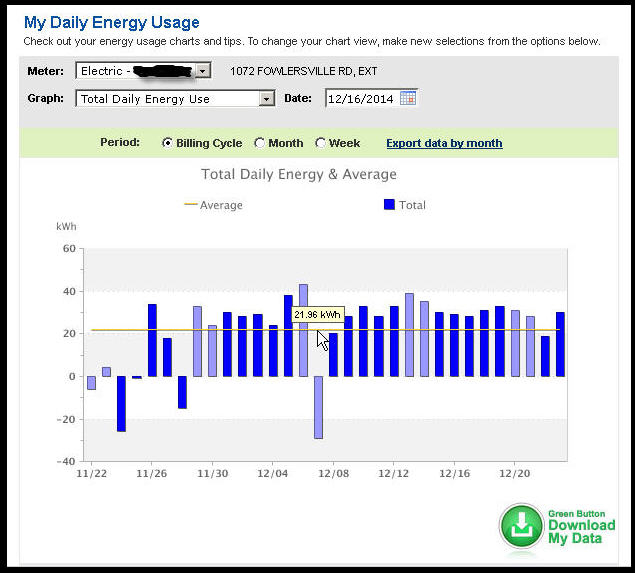
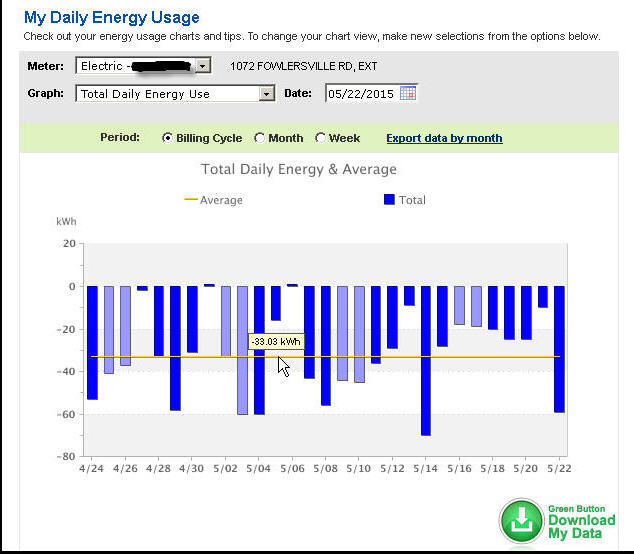
This is the tale of two months. A picture is worth a thousand words.
 All six trackers active!!! System certified!!!
First years full PV production will be done on 6/17 EOD (End Of Day). It looks like it will be around 15 MWH (Mega Watt Hours), give or take........ not bad.... 14 was projected. PPL payback amount will be around 4.5 MWH's, slightly less because there is still production to be brought back on line and some load reduction to be done. WHen all is complete including wind, 7 MWH's should be the over production before EV's are had. The two EV's are using about 7 MWH's per year leaving me neutral when production in 15 MWH a year or higher.
Last Updated 8/2/2026
2024 is another PV Record Buster !!
Its official! 2024 is also a PV production record buster. The main tracking array produced 18.503 MWH's. However, the gorund test array added another 4517 KWH's to that, totaling 22.847MWH's, an increase over last year of .173 MWH's total.
UPDATE 6/23: Kia Nero traded in for Kia EV6.
UPDATE 9/22: New 40+ KWH battery backup installed with coming 4.6KW direct feed array. See details under 'My Solar Home', Solar PV.
********************************************
BLOG site for "open" topic writings, by myself!
https://nosidestaken.blogspot.com/2025/01/a-republic-if-you-can-keep-it.html
https://nosidestaken.blogspot.com
********************************************
Where to Find Us:
www.WeAreSolar.com (Fitch Consulting)
1072 Fowlersville Rd
Berwick, PA 18603
Phone: 570-752-4827
Update 6/2026: Peak solar production for my house in one day is about 142.7KWH.
What's New
01/12/2021 My new GEO heat pump is finally installed. I have been "tweeking" it until today, 01/16/2021. It works GREAT!! Unlike it predecessor's, it actually performs up to its submittal sheet. LOVE IT!!

I finally finished my electric overhead to underground conversion along with the transformer upgrade (15KW to 50KW).
May Monthly Production Record Gets blown away in June at 2517KWH !!
Made changes to my PV tracking system. The main PV inverter was upgraded from an SMA SB-US-8000 to a Fronius Primo 11.4 (11,400 watts). Additionally, the PV arrays were upgraded with 20 SunPower 327 watt modules leaving 16 of the original Canadian Solar 255 watt modules, bringing the total output of the array from 9.18KW to 10.620KW. The combination of the inverter upgrade coupled with the array KW upgrade, should generate an additional 2 to 3 MWH a year. I hope this will compensate for the increased cloudiness being produced by Green House Gas Heating Climate change. It took a fair amount of work to do all this....
UPDATE: All 36 modules are being changed out which will result in an array output of 11,772 KW. On a very sunny year, 20 MWH should be within reach.
PV Yearly Production Numbers
2022-2024. Yearly numbers are running around 22 to 23MWH's a year with ground test array added.
2021 PV Production is 19.325 MWH which just misses the record breaker last year. Across the year, 2021 was much cloudier but crazy super sunny March made it almost even. Since the system has been running, we have produced over 129 MWH's total.
2020 PV Production is 19.375 MWH which is a new record buster.!! The only month that did not gen more than last year was October. Our usage was up due to more driving and general increases, which the increase in production was able to satisfy. That production defers about $2000.00 worth of power from the grid.
2019 PV Production is 16.787 MWH.
2018 PV Production is 12.463 MWH.
2017 PV production is 14.293 MWH.
2016 PV production is 15.629 MWH.
2015 PV production is 14.543 MWH.
2014 PV production is 7.711 MWH, first year partial production. 9.374 MWH were produced through the entire startup test phase of the system before certification.
2019 production was a record breaker, do to the upgrade being active for 1/2 the year along with being decently sunny. Most likely, if the array upgrade had been active for the whole year, 17 or 18 MWH's would have easily been had.
2018 production was the worst production ever, not only for PV but for all solar. The rain and cloud cover was unpresidented! WE blew right through the 13 Megawatt range and landed in the low 12's. An increase in array capacity might be necessary to adapt to the GH GH'ing realities causing climate change, to resore a slight electrical surplus.
2017 production down 1.34 MWH from last year. All months produced less except for December which is the cloudiest month of the year.... Ironic...
Electric car miles for the fifth year are 15863 saving 690 gallons of gas at an avoided cost of $1932, bringing the five year total to $9172.00. Covid-19 reduced mileage, but a third car (Bolt) and a third driver beginning in August, over turned the shortfall.
Electric car miles for the forth year are 14037 saving 610 gallons of gas at an avoided cost of $2014.00 bringing the four year total to $7239.00. Gas went up and down over the period.
Electric car miles for the third year are 13,220 saving 575 gallons of gas at an avoided cost of $1955.00 bringing the three year total to $5225.00. Gas prices steadily climbed throughout the year. Total number of gallons not used stands at 1790.
Electric car miles for the second year are 14,830 saving 645 gallons of gas at an avoided cost of $1870.00 bringing the two year total to $3270.00. Not bad for only 2 years at fairly low gas prices...
Electric car miles for the first year ran about 13,000 miles of energy free driving. The gas saved which would have been burned by the car that the Leaf replaced equals about 570 gallons at an avoided gas cost of $1400.00.
Total mileage across the three years equals 41,050 miles. At a gross electric usage of 3 miles per KWH year round, this translates to 13.68 Megawatt hours of electricity, or 4.56 Megawatt hours per year. With the addition of the Ford C-Max plug-in Hybrid over the last year, the total transportation electric load is increased by about 2 megawatt hours more, bringing the household trans electric yearly load to about 6.6 megawatt hours.