Understanding Evacuated Tube
Solar Myth's
#1. Evacs hold frost longer so the systems will not turn on and therefore collect less heat.
The following graph shows collector temp (cyan), storage temp (green), outside temp (white) on April 9th, 2009 starting at sunrise on what will be a PSD until about 1:00 PM in the afternoon. The low was about 19 DegF at sunrise. The first three photos after the two graphs show the state of the frost right at the first turn on cycle. Note the collector temp had no trouble rising under heavy frost. The frost at sunrise was of course heavier than in the photos which come later at the first cycle. The last photo shows the collector when the frost is almost gone. Notice the shape of the collector temp curve (cyan). The curve is even and shows no "quick jump" once the frost is almost gone. It also has no trouble gaining temp and turning on early. The times on the graph are DST, so the collector actually had its first cycle just before 7:00 AM EDT. The simple answer to this is that the frost really functions as a light diffuser rather than a light absorber. Since the evacs don't loose their heat, the "frost" on the tubes does not "cool off" the tubes. In short, the frost has little effect on net energy gain. The second graph shows the time scale compressed so you can see how the whole day "panned" out.
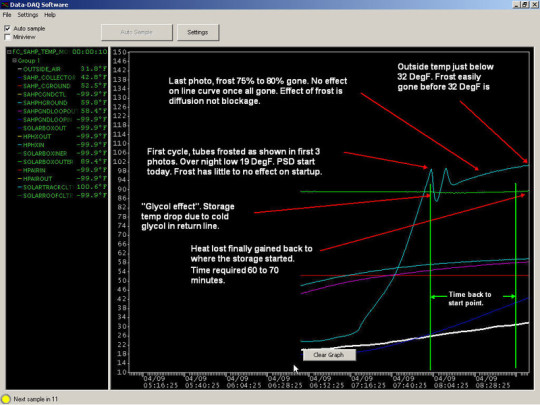
The sharp rising curve is the collector temp, the white one is the outside air temp, the green line is the storage temp. The vertical green lines show the time it takes to get back to the storage starting temp, from what I call the "glycol" effect. First cycle occurs just before 7:00 AM EDT.
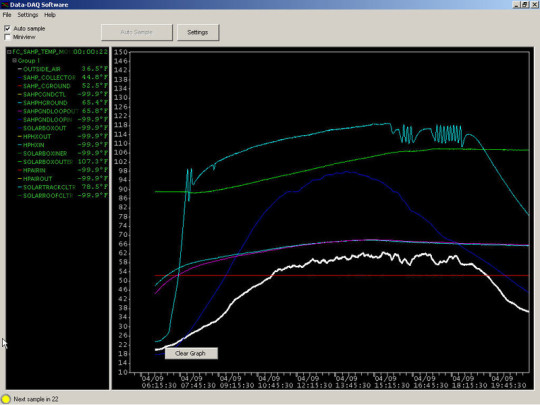
Entire day shown to sun down. Note later in the day where some fair weather cumulus clouds came into play. Can you see it on the graph???
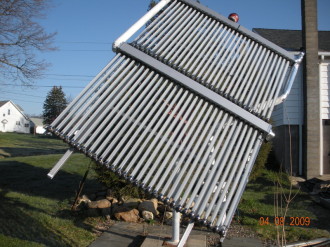
Morning frost at first cycle, photo one.

Morning frost at first cycle, photo two.
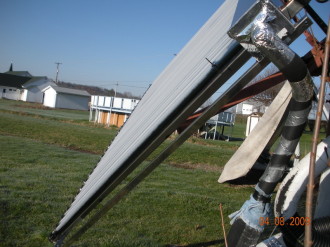
Morning frost at first cycle, photo three.
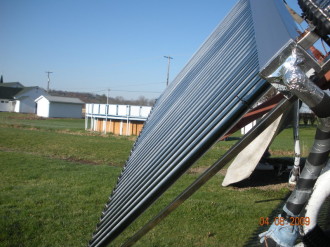
Frost almost gone. Outside air temp still under freezing.

Sun position at frost almost gone photo. This is the Eastern sky, sun still low.... Camera date is off by one, should be the 9th...
Last Updated 6/27/2026
2024 is another PV Record Buster !!
Its official! 2024 is also a PV production record buster. The main tracking array produced 18.503 MWH's. However, the gorund test array added another 4517 KWH's to that, totaling 22.847MWH's, an increase over last year of .173 MWH's total.
UPDATE 6/23: Kia Nero traded in for Kia EV6.
UPDATE 9/22: New 40+ KWH battery backup installed with coming 4.6KW direct feed array. See details under 'My Solar Home', Solar PV.
********************************************
BLOG site for "open" topic writings, by myself!
https://nosidestaken.blogspot.com/2025/01/a-republic-if-you-can-keep-it.html
https://nosidestaken.blogspot.com
********************************************
Where to Find Us:
www.WeAreSolar.com (Fitch Consulting)
1072 Fowlersville Rd
Berwick, PA 18603
Phone: 570-752-4827
Update 6/2026: Peak solar production for my house in one day is about 142.7KWH.
What's New
01/12/2021 My new GEO heat pump is finally installed. I have been "tweeking" it until today, 01/16/2021. It works GREAT!! Unlike it predecessor's, it actually performs up to its submittal sheet. LOVE IT!!

I finally finished my electric overhead to underground conversion along with the transformer upgrade (15KW to 50KW).
May Monthly Production Record Gets blown away in June at 2517KWH !!
Made changes to my PV tracking system. The main PV inverter was upgraded from an SMA SB-US-8000 to a Fronius Primo 11.4 (11,400 watts). Additionally, the PV arrays were upgraded with 20 SunPower 327 watt modules leaving 16 of the original Canadian Solar 255 watt modules, bringing the total output of the array from 9.18KW to 10.620KW. The combination of the inverter upgrade coupled with the array KW upgrade, should generate an additional 2 to 3 MWH a year. I hope this will compensate for the increased cloudiness being produced by Green House Gas Heating Climate change. It took a fair amount of work to do all this....
UPDATE: All 36 modules are being changed out which will result in an array output of 11,772 KW. On a very sunny year, 20 MWH should be within reach.
PV Yearly Production Numbers
2022-2024. Yearly numbers are running around 22 to 23MWH's a year with ground test array added.
2021 PV Production is 19.325 MWH which just misses the record breaker last year. Across the year, 2021 was much cloudier but crazy super sunny March made it almost even. Since the system has been running, we have produced over 129 MWH's total.
2020 PV Production is 19.375 MWH which is a new record buster.!! The only month that did not gen more than last year was October. Our usage was up due to more driving and general increases, which the increase in production was able to satisfy. That production defers about $2000.00 worth of power from the grid.
2019 PV Production is 16.787 MWH.
2018 PV Production is 12.463 MWH.
2017 PV production is 14.293 MWH.
2016 PV production is 15.629 MWH.
2015 PV production is 14.543 MWH.
2014 PV production is 7.711 MWH, first year partial production. 9.374 MWH were produced through the entire startup test phase of the system before certification.
2019 production was a record breaker, do to the upgrade being active for 1/2 the year along with being decently sunny. Most likely, if the array upgrade had been active for the whole year, 17 or 18 MWH's would have easily been had.
2018 production was the worst production ever, not only for PV but for all solar. The rain and cloud cover was unpresidented! WE blew right through the 13 Megawatt range and landed in the low 12's. An increase in array capacity might be necessary to adapt to the GH GH'ing realities causing climate change, to resore a slight electrical surplus.
2017 production down 1.34 MWH from last year. All months produced less except for December which is the cloudiest month of the year.... Ironic...
Electric car miles for the fifth year are 15863 saving 690 gallons of gas at an avoided cost of $1932, bringing the five year total to $9172.00. Covid-19 reduced mileage, but a third car (Bolt) and a third driver beginning in August, over turned the shortfall.
Electric car miles for the forth year are 14037 saving 610 gallons of gas at an avoided cost of $2014.00 bringing the four year total to $7239.00. Gas went up and down over the period.
Electric car miles for the third year are 13,220 saving 575 gallons of gas at an avoided cost of $1955.00 bringing the three year total to $5225.00. Gas prices steadily climbed throughout the year. Total number of gallons not used stands at 1790.
Electric car miles for the second year are 14,830 saving 645 gallons of gas at an avoided cost of $1870.00 bringing the two year total to $3270.00. Not bad for only 2 years at fairly low gas prices...
Electric car miles for the first year ran about 13,000 miles of energy free driving. The gas saved which would have been burned by the car that the Leaf replaced equals about 570 gallons at an avoided gas cost of $1400.00.
Total mileage across the three years equals 41,050 miles. At a gross electric usage of 3 miles per KWH year round, this translates to 13.68 Megawatt hours of electricity, or 4.56 Megawatt hours per year. With the addition of the Ford C-Max plug-in Hybrid over the last year, the total transportation electric load is increased by about 2 megawatt hours more, bringing the household trans electric yearly load to about 6.6 megawatt hours.